Hand Calculations to Determine the Pointing Resolution
of the HFT + HPD + IST + TPC
I have extended the hand calculations that Yan and I started making last year using the equations from the particle physics handbook. The update to last year’s code is that we now use the Kalman Filter tracking techniques that were first introduced by Billoir, NIM 225 (1984) 352. Billoirs method yields similar results to the PDG methodology but it gives more accurate results for MCS at the expense of introducing other approximations in estimating the pointing resolution for a detector that is not located at one end of a system of detectors.
The code is evolving but the latest version can be found in my directory tree:
/star/u/jhthomas/STAR/hft/Matrix3Resolution.C
If you try running the code, I recommend that you compile it first. In other words, run it using the following command:
.x Matrix3Resolution.C++
The code allows us to build a system of detectors using a simple script and it allows us to explore changes in the base system such as to add a detector or subtract a layer. A typical set of scripts (used to generate one of the figures, below) looks like this:
tpc end t-vtx
vtx d-hft1 d-hft2 d-hpd d-ist1 d-ist2 d-ssd tpc end t-ssd
vtx d-hft1 d-hft2 d-hpd d-ist1 d-ist2 ssd tpc end t-ist2
vtx d-hft1 d-hft2 d-hpd d-ist1 ist2 ssd tpc end t-ist1
vtx d-hft1 d-hft2 d-hpd ist1 ist2 ssd tpc end t-hpd
vtx d-hft1 d-hft2 hpd ist1 ist2 ssd tpc end t-hft2
vtx d-hft1 hft2 hpd ist1 ist2 ssd tpc end t-hft1
vtx hft1 hft2 hpd ist1 ist2 ssd tpc end t-vtx
where the meaning of each symbol is obvious because the code is written in C++ and C++ is a self documenting language. (Eg. d-hft1 is an inactive HFT layer, the material is present but the detector does not contribute to the measurement. ‘t-vtx’ means to target the vertex and ask what the pointing resolution is at the vertex (aka dca resolution)).
The first test of the code is to try to reproduce the pT resolution that was observed in the TPC before the SVT was installed. The data were taken at 0.25 Tesla and were published in the STAR NIM volume. Figure 1 shows the fit for anti-protons. Figure 2 shows our prediction for Kaons at the same settings.
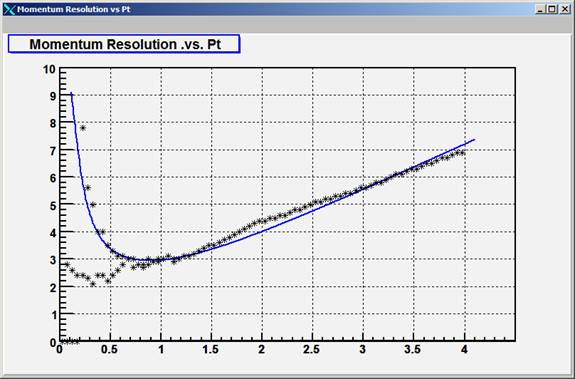
Figure One: Anti-protons at 0.25 Tesla
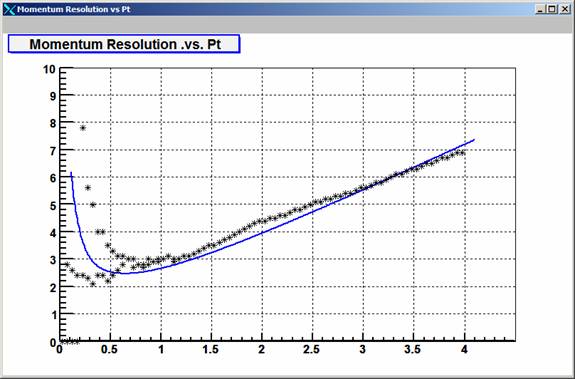
Figure Two: Kaons at 0.25 Tesla
Since we do not have a direct measurement of the TPC’s resolution, I have tuned the macro to achieve the best fit to the date we published in NIM. The best fit requires a TPC point-resolution of 575 microns, with a 3 mm vertex constraint. These are very reasonable numbers and suggests that the program is realistically predicting the performance of the TPC. The remaining parameters for the macro are shown, below, and are taken from the design parameters for our new detectors.
#define Mass 0.540 // Mass of the test particle
#define BField 0.250 // Tesla
#define AvgRapidity 0.5 // for MCS calc crossing angle
#define VtxResolution 0.03000 // Primaries have ~3 mm vtx
#define NewVtxResolution 0.00300 // cm NewVertex to study effect of a refit vertex
#define BeamPipe1Resolution RIDICULOUS // Beampipe is not active as a detector
#define
Hft1Resolution
0.0010 // cm 30 x 30 micron
pixels
#define
Hft2Resolution
0.0010 // cm 30 x 30 micron
pixels
#define BeamPipe2Resolution RIDICULOUS // Beampipe is not active as a detector
#define
HpdResolution
0.0150 // cm 50 x 425 micron pixels
#define
Ist1Resolution
0.0250 // cm 60 x 1000 micron pixels
#define
Ist2Resolution
0.0250 // cm 60 x 1000 micron pixels
#define SsdResolution 0.0150 // cm 25 x 750 microns double sided
#define IFCResolution RIDICULOUS // IFC is not active as a detector
#define TpcResolution 0.0575 // cm 600 x 1500 microns
#define VtxThickness 0.0000 // % Radiation Lengths
#define BeamPipe1Thickness 0.0015 // % Radiation Lengths (as in 0.01 = 1%)
#define Hft1Thickness 0.0028 // % Radiation Lengths
#define Hft2Thickness 0.0028 // % Radiation Lengths
#define BeamPipe2Thickness 0.0015 // % Radiation Lengths
#define HpdThickness 0.0100 // % Radiation Lengths
#define Ist1Thickness 0.0150 // % Radiation Lengths
#define Ist2Thickness 0.0150 // % Radiation Lengths
#define SsdThickness 0.0100 // % Radiation Lengths
#define IFCThickness 0.0052 // % Radiation Lengths
#define TpcAvgThickness 0.00026 // % Average per TPC row (i.e. total/45 )
#define VtxRadius 0.0 // cm
#define BeamPipe1Radius 2.05 // cm
#define Hft1Radius 2.5 // cm
#define Hft2Radius 7.0 // cm
#define BeamPipe2Radius 8.55 // cm
#define
HpdRadius
9.2 // cm
#define
Ist1Radius
12.0 // cm
#define
Ist2Radius
17.0 // cm
#define
SsdRadius
23.0 // cm
#define IFCRadius 47.25 // cm Middle-Radius of the IFC
Note: This macro is a 2D macro. It does not know about r-phi and Z resolution as separate quantities. I can and will build a 3D model … but that is for another day. In this model, I assume perfect resolution for the Si detectors and I take into account different r-phi and Z resolutions by preserving the area that is resolved by each Si layer and thus quote a single radius of equal area for each layer. This is not the right thing to do to get the ultimate pT resolution, but I believe it is the right thing to do when you ask about hit association probabilities … and that is what is important, now.
Results:
Figure Three shows the DCA resolution for the TPC acting along and again with a 3 mm vertex constraint. The vertical axis is in microns and the horizontal axis is in GeV/c. You can see the effects of MCS at low momentum. You can also see the effect of the vertex constraint because it forces an asymptotic resolution of 3 mm at the lowest momenta.

Figure Three: TPC with and without a 3mm vertex constraint.
The dashed line in all of these figures is a reference line that represents the resolution of the HFT acting alone. The dashed line is the two point formula for two HFT layers, without any multiple scattering from any other source. It is not an approximation, it is an exact formula for a two layer detector.
Figure Four shows the pointing resolution of the TPC + Si detectors at various layers in the system. So, for example, the top line is the pointing resolution of the TPC at the SSD. It would be the “DCA” resolution if the vertex was located at the radius of the SSD. The bottom line is the HFT reference line. The lines in-between represent the addition of active layers in the system. In order they are: 1.) TPC alone 2.) TPC pointing at the SSD 3.) pointing at the IST-2 layer, 4.) pointing at IST-1, 5.) pointing at HPD, 6.) pointing at HFT-2, 7.) pointing at HFT-1, 8.) pointing at the vertex. You can see that the full system comes very close to achieving the ideal resolution of the HFT layers acting alone. In all cases (except the TPC alone), a 3 mm vertex constraint was applied. The vertex constraint does not help the outer layers very much because of the MCS in the detectors between the layer of interest and the vertex.
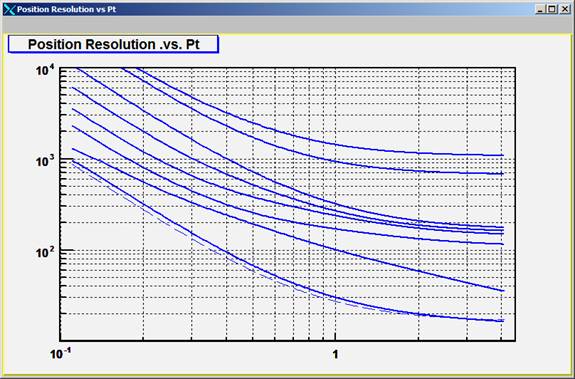
Figure Four: Pointing resolution for the different layers of the TPC + Si detectors.
Now for something interesting; suppose that we change the vertex constraint. Figure five shows the TPC-alone and HFT-reference lines, and it shows the full system acting with a 3 mm vertex constraint, a 300 micron vertex constraint, and a 30 micron vertex constraint. The 30 micron vertex constraint is a very power tool that can achieved with a vertex refit once all the Si points are found. It improves the pointing resolution in the critical 400-900 MeV region by a factor of two. See figure 6.
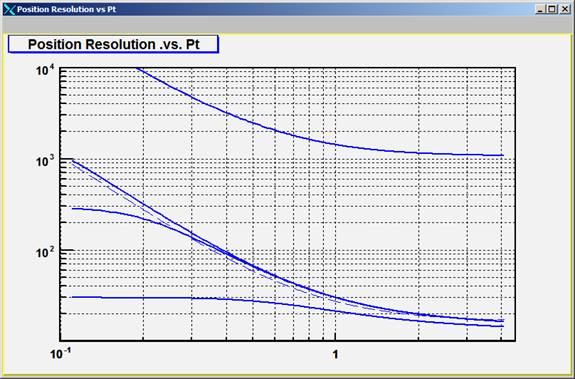
Figure Five: Pointing resolution of the system using a 3 mm, 300 micron, and 30 micron vertex constraint, respectively.
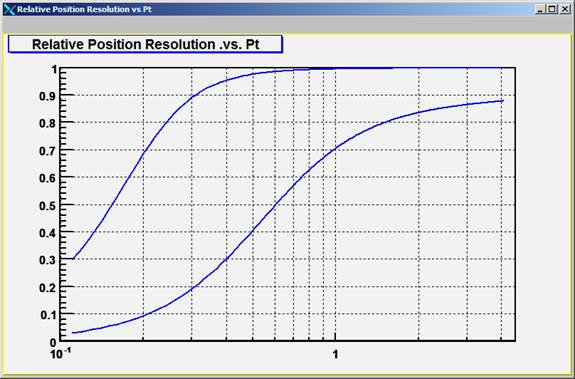
Figure Six: Relative improvement in the pointing resolution for a 300 micron vertex constraint and a 30 micron vertex constraint. A 3 mm vertex constraint is the reference in both cases.