Leo Greiner February 26, 2004
Current Status of Thermal Imaging Tests for LBL Pixel Detector.
Thermal IR imaging of Silicon and Kapton heater with an IR camera.
Two thermal testing models were constructed. They are shown below;
Piece 1 consists of resistors connected in series and glued to the Silicon detector mockups.
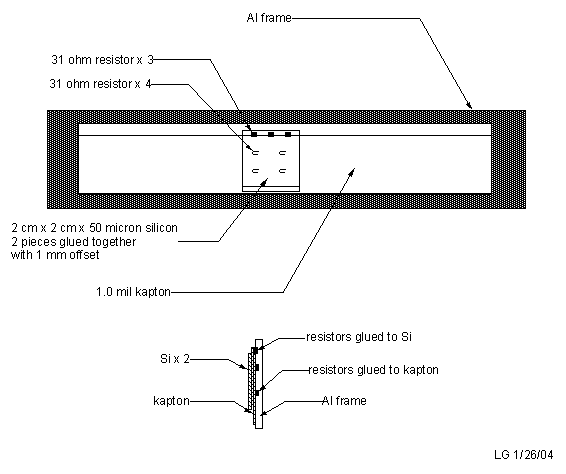
Piece 2 consists of vapor deposited platinum on 5 mil kapton in a serpentine heater pattern. The active heated area of the piece is ~2cm x 155 cm.

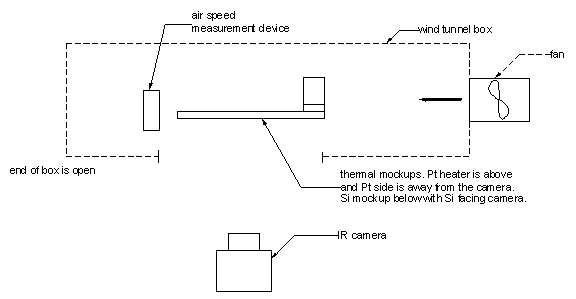
The initial testing setup is shown schematically below;
The power use profiles of the readout chip are expected to
be ~90 mW along the upper edge for the ADCs and ~180 mW distributed over the rest of the 2cm x 2 cm chip for the
memory. This figure was obtained from Robin at http://lemonade.lbl.gov/tiki/tiki-index.php?page=ReadoutChip
(this figure has changed slightly since initially put forth on
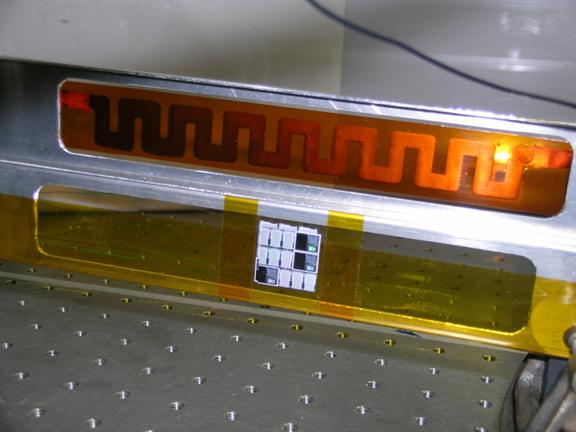
Here is a photo of the test setup used for images 1-6.
When viewing the images, the following diagram showing the relevant structures in the image will be helpful
The following images were obtained:
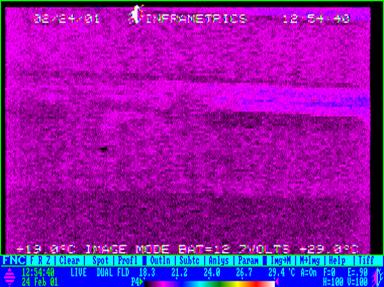
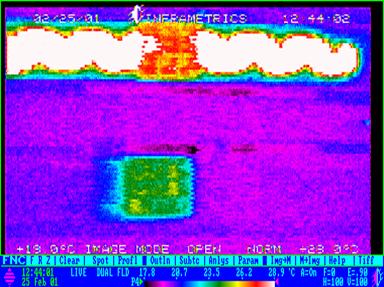
1. Baseline – power off, fan off. At this temperature, the emissivities of the Si, Kapton and Aluminum appear to be about equal.
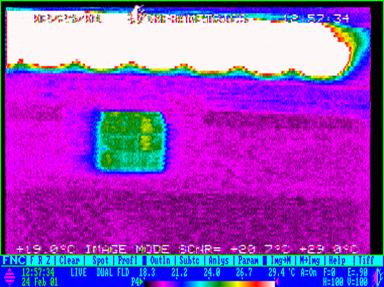
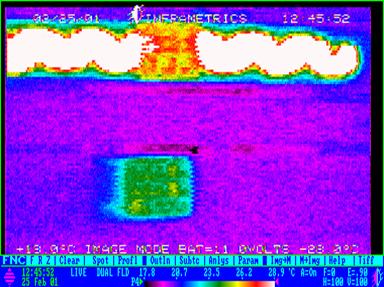
2. Lower image is the Si, Upper image is the Pt heater. For the Si, ADC = 2.8V, MEM = 4.5 V. This corresponds to 90mW and 164 mW respectively. This setting was used for all of the data taken from the resistor heated mockup. The power in the Pt heater is V = 5.21 V, A = 0.55A for 2.86W in 31 cm^2 or 92 mW / cm^2. Air is flowing at 0.8 m/s.
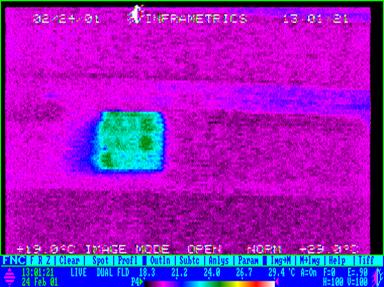
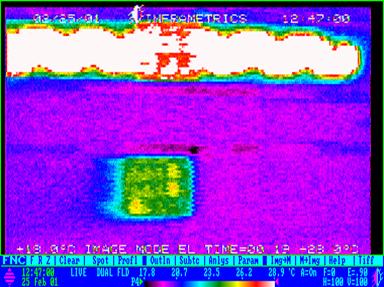
3. Pt off. Air = 0.8 m/s.
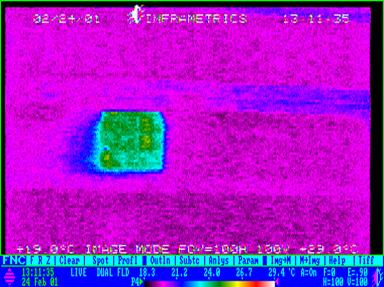
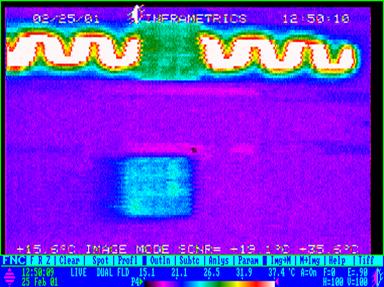
4. Pt off, Air = 0.45 m/s.
5. Pt off, air = off. This is just a snapshot as the Si was heating up to look for localized heating from the
resistors. It’s very minor if there. The top resistors are glued directly to
the Si and there doesn’t appear to be any significant
hot spots. Si appears to be a good thermal
conductor. 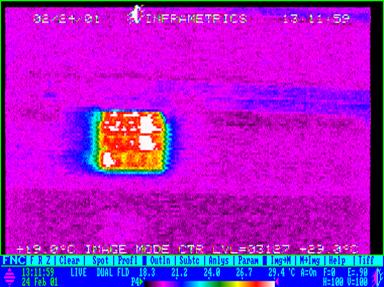
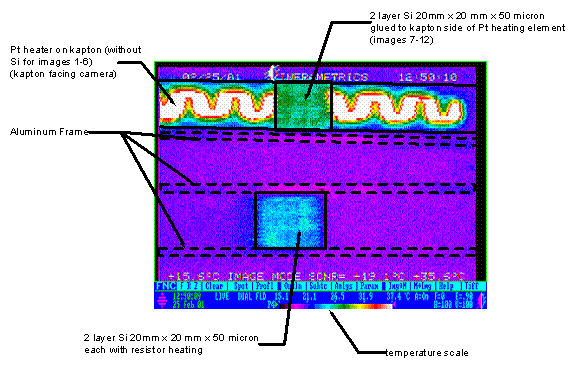
6. The Si is off. The scale is
changes to show the indicated temperature of the kapton
on the other side of the Pt heater strip. 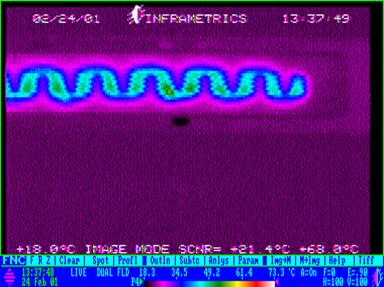
At this point, we are worried about the large apparent temperature difference between the kapton and the Si models. To look a bit further, we constructed a duplicate sandwich of 2 offset Si pixel detector dummies (exactly like the ones with the resistors glued to the back) and glued this to the kapton side of the Pt heater strip. The model now has the form shown below.

In addition, starting with image 9, we covered the resistors glued to the back of the lower Si model to help prevent air cooling of the resistors themselves to help with heat transfer into the Si. This resulted in the images shown below.
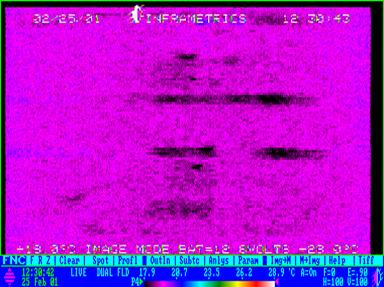
7. Power off, air off. Baseline view.
8. Pt heater strip V = 4.45V, A = 0.47A power = 67.5 mW / cm^2. Resistor model at nominal
voltages. Air = 0.8 m/s. 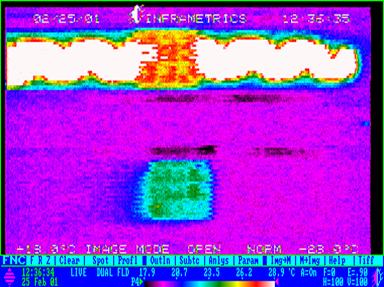
9. As above, but with the heating resistors on the lower mockup covered with kapton tape to help prevent air cooling on the back of the piece. Note that this does help the heat transfer into the Si.
10. Air velocity = 1.0 m/s. All heating as before.
11. Air velocity = 0.5 m/s. All heating as above.
12. Air velocity = 0.8 m/s. All else at nominal. The thermal scale is extended.
As an additional test, we tried taking thermal readings with a thermocouple probe touching some of the surfaces to confirm the temperatures. When the thermocouple was touching the kapton side of the Pt heater strip, there was no change in the IR image and the thermocouple probe gave a reading of 28 C. When the thermocouple was touching the Pt side of the heater, the IR image showed a spot temperature drop from 43 C to 39 C. The thermocouple gave a reading of 33 C. These readings do not seem too unreasonable given the coupling into the (relatively) large thermocouple tip and the apparently significant thermal resistance of the kapton.
We can see that we still have a few minor glitches in our understanding of the testing system response and emissivity but the results are consistent enough to be quite encouraging. The Si thermal conductivity is excellent and the temperature on the Si was within 2 C for all reasonable configurations. Air cooling at ~0.8 m/s gives a temperature rise in the Si of 5-7 C which appears reasonable.
This was done with simple models. The next models will be
full mechanical and thermal mockups and will give much more relevant and
reliable results.